

Frontier AI models are improving every quarter, but the required level of hardware to run a model of equivalent intelligence halves roughly every 3 months.
Although hardware prices are increasing, model performance continues to improve while the size of models at equivalent intelligence decreases. This means that organizations may require less hardware than they think they need. Our thesis is that you have two options for the best economical outcomes: either rent frontier intelligence, or own the trailing edge.
Better models are getting smaller
Over the past few years, the most powerful models have been available to anyone with an API key and are steadily improving in performance.
Artifical Analysis showed that the best model available to the public is gaining ~19 points per year on their Intelligence Index, and the pace is only increasing.[1] Epoch AI determined that the rate of improvement in frontier models has almost doubled since April 2024, scored using their Epoch Capabilities Index (ECI).[2]
Frontier models are consistently getting better, but not as much research focuses on the idea that models are growing exponentially in capability at every size. The question many people should be asking: How much hardware does it take to reproduce a level of intelligence once it exists?
In March 2023, achieving GPT-4-level capability required an estimated 1.8 trillion parameters.[3] In July 2026, fitting GPT-4-level capability can fit in a model with around 14 billion parameters. This is a model ~129x smaller in size, requiring vastly less compute than before.
Other model benchmarks follow similar trends. o1-level capability fell from 671 billion parameters to 25 billion in eleven months, and o3-level capability went from roughly a trillion to 27 billion within a single month of open models reaching it at all.
This is a regular enough occurrence now that some researchers have named it the "densing law": the capability obtainable per parameter is doubling roughly every three and a half months.[4]
Figure 1 shows intelligence climbing on the left axis, the parameters required for fixed intelligence falling down the right. You can click on each data point for the source.
Intelligence: Artificial Analysis Intelligence Index v4.1 retro-scores, one consistent scale across the period. The dark line is the running best; muted points are every other scored release, through the four frontier launches of mid-July 2026. Size series: the smallest open-weights model to reach each fixed level; hollow points carry published estimates rather than disclosed sizes. The right axis is logarithmic — each gridline is ten times fewer parameters.
The wait between a capability debuting at the frontier and fitting in a workstation-class model (35 billion parameters or fewer) is also decreasing:
The economics of running smaller models
From an economics perspective, serving a fixed level of capability gets roughly 10× cheaper per year.[5] When measured benchmark by benchmark, it can be anywhere between 9× and 900× per year, with a median near 50×.[6]
Some of that decline is coming from better models (3x per year), while the rest comes from a combination of better hardware optimization and providers competing on margins.[7]
Hardware is a tricky asset to account for, as current demand has caused hardware prices to rise, yet some hardware has also depreciated in price over the last few years. H100s that sell new for $25,000–$40,000 in 2026 trade for $15,000–$28,000 used, a 30–40% discount from current new pricing.[8]
You could look at this from the angle that buying hardware is purchasing a depreciating asset. However, another angle is that if you bought an H100 in 2023, you now own hardware capable of running better, newer, and denser models over time. Its financial value may have fallen, but its practical utility has technically increased. That said, it doesn't capture future declines in hardware prices nor provider margins decreasing.
It's also a strong argument for organizations which already own hardware. If a sufficient model fits on hardware you already own, you gain the benefits of better local models that make older hardware more useful over time without the capex of new hardware at inflated prices.
That leaves a separate question: when does buying new hardware make more economic sense than renting?
It likely depends on how much time you think your compute will be sitting idle. If you can keep the hardware busy more than 50–83% of the time, it may be smarter to own it than pay a provider.[9]
However, over a four-year horizon, with the API price falling tenfold yearly and the owner capturing sixty percent of that curve through model swaps, breakeven climbs to 88% sustained utilization.
You can test this out in Figure 2. The defaults are the observed values we have found. If you set deflation 1× (i.e. assuming prices do not fall), the model gives the standard total-cost-of-ownership result found in other research.
Net present cost per million-token stream at a 10% discount rate: own $1.29 versus rent $0.44. Cost anchors: an 8×B200 node at ≈$320–400K capital plus ≈$150K/yr operating cost, serving an o1-class open model (≈$0.30 per million tokens at full utilization) against a comparable API price of ≈$0.40. Simplifications favor ownership: no failure costs, no residual-value loss, demand exactly matching capacity.
The bet to buy hardware is sensible under the right assumptions. It is also separate from the decision to use hardware you already own, where the acquisition cost has already been paid.
Where this goes
The question most organizations should be asking is: for the capability of model we want to deploy, can we run it on the hardware we already own or plan to acquire?
Epoch suggests the amount of time for a model to go from frontier to workstation-capable is around 6-12 months, with small models improving faster than the frontier itself[10]. Our own tier data suggests that this timeframe has also compressed from sixteen months to just seven in under 2 years.
“Runnable on owned hardware” means a ≤35B-total-parameter model — the class that fits a workstation GPU or distributes across a fleet of AI PCs. The shaded band is the capability premium of renting the frontier; the milestone dates mark when it reaches zero for a given level. Defaults are the observed values; the projection is linear in the index and should not be trusted far beyond the horizon shown.
The authors of the densing law warn against extrapolating indefinitely, and it's impossible to do so accurately.[4] You should hold the results from Figure 3 loosely, as they provide data based on if current trends persist.
What we would do
Based on our research, we think that soon there are only going to be two real options: own the trailing edge, or rent the frontier.
For most organizations, whether it's now or at some point in the future, owning the trailing edge (i.e. doing inference on older, open frontier models locally) is going to be a sensible bet. Local models are closing in on the point where they are good enough for a lot users, and come with benefits which can't necessarily be priced into the economic side of things.
By owning the silicon and running your own models you gain sovereignity, privacy, and control. Terms and conditions can change, pricing plans can change, and although the cost of tokens is decreasing, net usage is trending upwards which could lead to larger costs. Be wary of hardware currently being overbought, and use what you already own where possible.
For those who want or need the most powerful models and don't mind the cons, rent frontier intelligence. API pricing is currently one of the fastest deflating costs in the AI economy, and pay-as-you-go can be more efficient for smaller workloads. Count it as the capex it is.
Full disclosure: Cascadia is building distributed inference runtimes across fleets of Intel AI PCs that organizations already own. We are betting on this thesis because we believe on-prem AI and hybrid setups are the future because of the cost and data privacy advantages. That being said, the data is the data. We encourage you to form your own conclusions.
Notes
- [1]Artificial Analysis Intelligence Index v4.1, retro-scored leaderboard. Snapshot of July 16, 2026 via the BenchLM mirror; interactive original at artificialanalysis.ai/models. benchlm.ai
- [2]Epoch AI, “AI capabilities progress has sped up” (Dec 2025) — frontier slope 8.3 → 15.5 ECI points/year, breakpoint April 2024. epoch.ai
- [3]Ege Erdil, “Frontier language models have become much smaller,” Epoch AI Gradient Update (Dec 2024) — the ~1.8T-parameter GPT-4 estimate. epoch.ai
- [4]Xiao et al., “Densing law of LLMs,” Nature Machine Intelligence 7, 1823–1833 (2025) — capability density doubles every ~3.5 months. nature.com
- [5]Appenzeller, “Welcome to LLMflation,” a16z (Nov 2024) — cost at equivalent capability falls ~10× per year. a16z.com
- [6]Epoch AI, “LLM inference prices have fallen rapidly but unequally across tasks” — 9–900× per year at fixed benchmark scores; median ~50×. epoch.ai
- [7]Gundlach et al., “The Price of Progress,” MIT FutureTech (2025) — algorithmic efficiency contributes ~3×/yr of the ~5–10×/yr total price decline; frontier-model prices are themselves rising. arxiv.org
- [8]Compute Exchange, “NVIDIA H100 GPU Price in 2026” — new units at $25,000–$40,000 and used units at $15,000–$28,000, or 60–70% of current new pricing. compute.exchange
- [9]Spheron, “LLM Inference On-Premise vs GPU Cloud” (2026) — breakeven against AWS on-demand pricing at roughly 50–83% sustained utilization. spheron.network
- [10]Somala & Emberson, “Frontier AI performance becomes accessible on consumer hardware within a year,” Epoch AI (2025) — consumer-GPU models lag the frontier by 6–12 months and improve faster than it. epoch.ai
Written July 2026. Intelligence scores are Artificial Analysis Intelligence Index v4.1 retro-scores (snapshot July 16, 2026); parameter counts are from model cards and technical reports, with estimates marked as such. The interactive figures contain the complete models; there are no additional assumptions off the page.
Related articles
Announcement
Use Apple Foundation Models as Claude Code Subagents
yeschef now supports Apple Foundation Models on macOS 27, so Claude Code can delegate smaller tasks to Apple’s on-device model and save on your Claude usage.
Read more
Research
Running Local AI on Business Laptops: What Hardware Do You Actually Need?
Many business laptops and workstations can now run capable AI models locally. This post covers what running AI on-device actually involves and how much RAM you need for different kinds of work.
Read more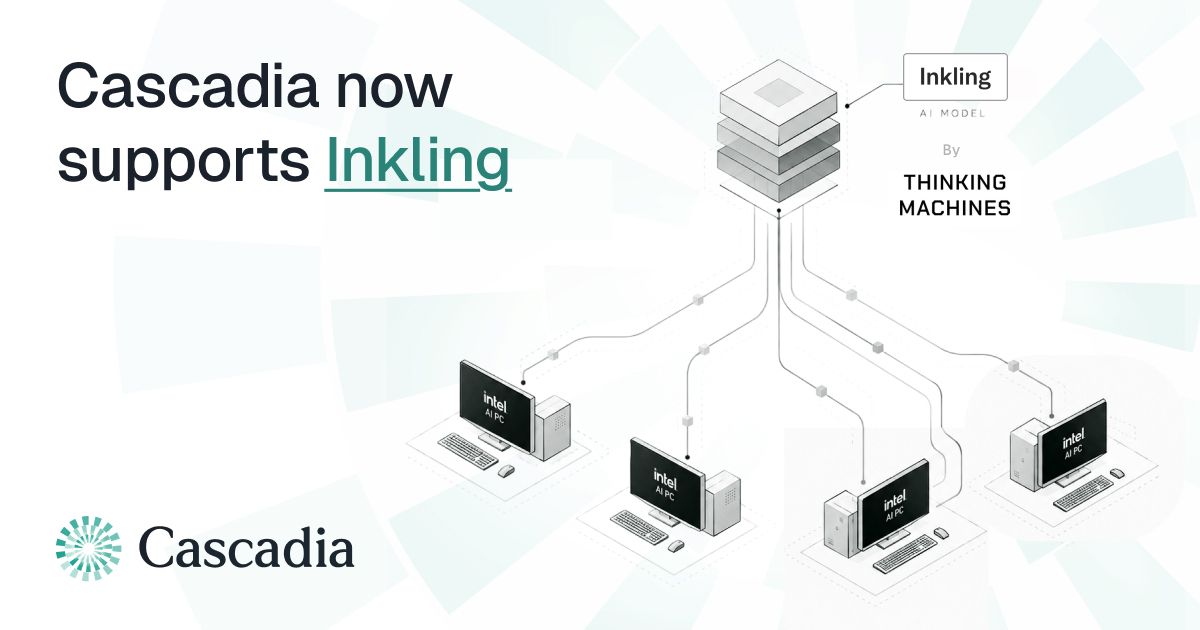
Research
Running Inkling (975B) Across Eleven Intel PCs with Cascadia
We ran Thinking Machines' Inkling (975B) across eleven Intel Core Ultra PCs using Cascadia, reaching a peak of 60.29 tok/s of aggregate decode throughput with 88 concurrent requests.
Read more
Research
Where NPUs Fit into LLM Inference
Most modern laptops now ship with an NPU, but few people use it for running LLMs.
Read more
Research
Building a Permissioned, Peer-to-Peer AI Inference Network
How a permissioned peer-to-peer system can turn a fleet of PCs into a single, on-prem inference endpoint.
Read more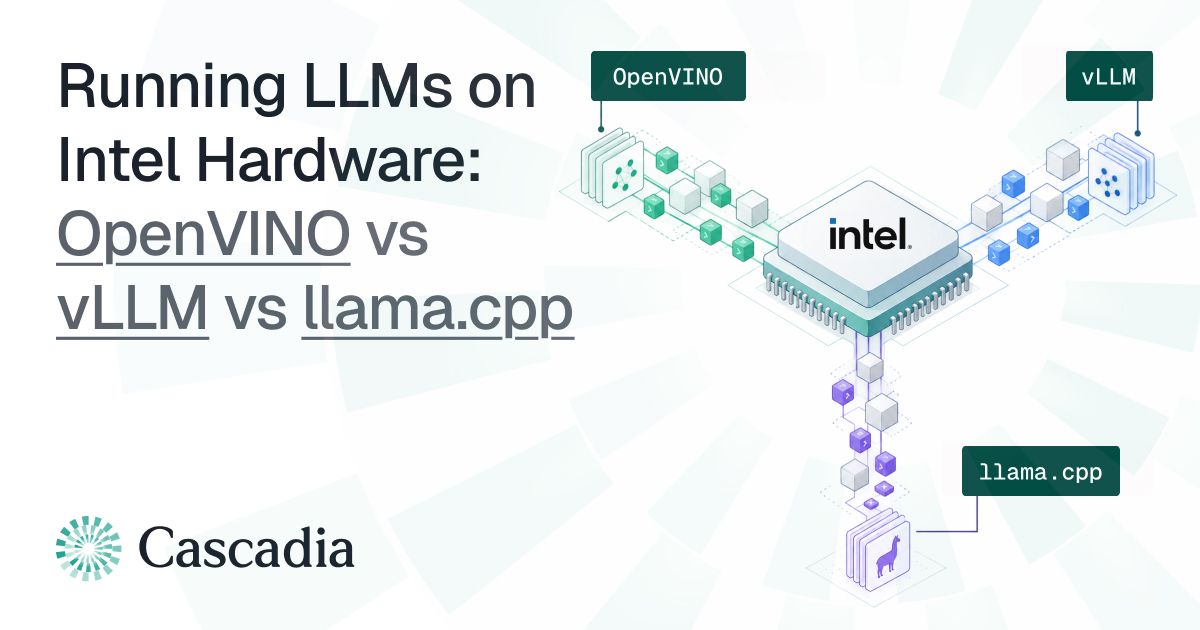
Research
Running LLMs on Intel Hardware: OpenVINO vs vLLM vs llama.cpp
Comparing various runtimes for Intel hardware.
Read more
